Ještě mě napadá, poslední dobou moc nefungovalo ani žvýšení taktů, prostě jsem klikal na svoje profily a nic se neaktivovalo, pořád to jelo na původní frekvenci. Nemůže to souviset?
K tomu nastavení:
Low-level HW access interface - používej Kernel Mode
Voltage control - nenastavuj "standard MSI" design na non-MSI kartách. Namísto toho zkus "reference design" nebo "third-party"
Zaškrtni "Enable Unified GPU usage monitoring"
Mimochodem, zkoušel jsi MSI AB úplně odinstalovat a na OC a monitoring použít třeba Sapphire Trixx - aby jsi vyloučil vliv MSI AB?
Added AMD Ellesmere and Baffin graphics processors families support
Added Overdrive N (Overdrive 7) technology support for AMD Polaris architecture based graphics cards
Added core voltage control for reference design AMD RADEON RX 460, AMD RADEON RX 470 and AMD RADEON RX 480 series cards with on-die SMC voltage controller
Added memory controller usage graph to hardware monitoring module for AMD graphics cards. Currently memory controller usage monitoring is implemented for AMD Ellesmere and Baffin graphics processors families only
Added GPU power draw graph to hardware monitoring module for AMD graphics cards. Currently GPU power draw monitoring is implemented for AMD Ellesmere and Baffin graphics processors families only
Added “Erase autosaved startup settings” option to “AMD compatibility properties” section in “General” tab. Starting from AMD Crimson drivers family, the driver is automatically saving hardware settings (e.g. overclocking or fan control settings) in the registry and apply it at Windows startup. It makes settings of any third party hardware overclocking tool virtually permanent, meaning that applied settings stay in the system even after rebooting or powering down the system. However, such implementation is unsafe and even potentially dangerous, because you're no longer able to undo unsafe overclocking with system reboot or even driver reinstall. To prevent such situations, MSI Afterburner can now optionally erase AMD driver's autosaved startup settings after applying new settings to hardware
Added GPU Boost 3.0 technology support for NVIDIA Pascal graphics cards:
Added percent based overvoltage support
Added voltage/frequency curve customization support. You may use traditional core clock slider on NVIDIA GeForce GTX 1070 and 1080 graphics cards to apply fixed offset to all voltage/frequency curve points as well as use brand new flexible voltage/frequency curve editor window for more precise per-point curve adjustment. The editor window can be activated either with “Voltage/frequency curve editor” button in the main application window or with <Ctrl> + <F> keyboard shortcut and it provides you the following features:
You may independently adjust clock frequency offset for each point with mouse cursor or <Up> / <Down> keys
You may hold <Ctrl> key to set anchor and fix clock frequency offset in minimum/maximum voltage point and adjust the offset of any other point with mouse to linearly interpolate the offsets between the anchor and adjustment points
You may hold <Shift> key while adjusting the offset of any point with mouse to apply the same fixed offset to all points. That’s equal to adjusting the offset with the slider in main application window
You may press <Ctrl> + <D> to reset offsets for all points
You may switch between traditional core clock control slider in the main window and voltage/frequency curve editor window to see how they affect each other in realtime
You may press <L> after selecting any point on the curve with mouse cursor to disable GPU dynamic voltage/frequency adjustment and lock the voltage and core clock frequency to a state defined by the target point. This feature allows you to test graphics card stability independently for each voltage/frequency point of the curve using real 3D applications or any stress test of your choice. In addition to stability testing usage scenario, MSI Afterburner allows you to save a curve with locked point setting to a profile, so you may easily switch between dynamic voltage/frequency management and fixed voltage/frequency settings in realtime (e.g. to achieve the maximum performance during benchmarking). Please take a note that fixed voltage and frequency settings do not allow you to disable power and thermal throttling
Increased default maximum limits for “Core clock”, “Memory clock” and “Memory usage” graphs to improve graphs readability on NVIDIA Pascal series graphics cards
Added configuration file switch, allowing you to toggle the source for “Power” graph on NVIDIA graphics cards. Normalized total power draw (i.e. normalized value from multiple power sensors installed on the graphics card) is selected by default per NVIDIA recommendation, however you can configure MSI Afterburner to display power draw from GPU sensor only
Improved representation of performance limits graphs for NVIDIA graphics cards per NVIDIA recommendations:
“Voltage limit” and “OV max limit” graphs have been merged into single “Voltage limit” graph
“Utilization limit” graph has been renamed to “No load limit” graph
“SLI sync” graph is now hidden on the systems with single NVIDIA GPU
Improved representation of performance limits graphs in On-Screen Display or in Logitech keyboard LCD. Now the names or currently triggered performance limits are being displayed in On-Screen Display or in Logitech keyboard LCD instead of previously used binary limits representation form
Community-created third party hardware database providing voltage control support on some non-MSI custom design graphics cards is now included in distributive
Added uP1816 voltage regulators support to provide compatibility with future custom design MSI graphics cards
Improved validation and handling of erroneous data reported after TDR or during runtime driver installation on NVIDIA graphics cards
Improved clock monitoring on GPU Boost 2.0 NVIDIA graphics cards after dynamic uninstallation/reinstallation of display driver during MSI Afterburner runtime
Added detection of runtime driver installation on NVIDIA graphics cards. Now MSI Afterburner is periodically checking the presence of NVIDIA driver and displaying notification message informing you that the connection with GPU is lost when the driver is being dynamically uninstalled during MSI Afterburner runtime
Startup profile is now also affected by “Lock profiles” button, which means that you cannot modify or delete your startup overclocking settings while this button is pressed. This feature can be useful to protect startup overclocking settings from modification while temporarily testing various overclocking scenarios on overclocked system
Added support for unofficial overclocking mode with disabled PowerPlay on PowerPlay7 capable hardware (AMD Tonga and newer graphics processors family)
Added unofficial overclocking support for AMD Polaris architecture based graphics cards
Added ability to use low-level hardware access interface on the systems with AMD graphics cards when legacy VGA BIOS image is not mapped to memory (e.g. in UEFI environment)
Improved compatibility with the systems with both Overdrive 5 and Overdrive 6 API AMD graphics cards installed
Added driver registry key detection for the secondary display adapters in SLI/Crossfire systems. Due to this improvement it is no longer necessary to temporarily disable Crossfire when altering some settings in “!MD compatibility properties” section (e.g. “Extend official overclocking limits” or “Enable ULPS” settings)
Improved hardware polling and application startup time on ULPS-enabled Crossfire systems with AMD Fiji and newer AMD graphics processors
Primary GPU usage is no longer cloned on all secondary GPU usage graphs on Crossfire systems when “Enable unified GPU usage monitoring” is enabled in “!MD compatibility properties”. Please take a note that only the primary GPU load is available on Crossfire systems when this option is enabled
Updated IO driver provides more secure MMIO access interface
Fixed bug causing the maximum value to be invisible on some hardware monitoring graphs under certain conditions (e.g. “Framerate” or “Frametime” graphs After closing 3D application)
Added ability to define numpad keys as hotkeys when <Num Lock> in on
Guru3D RivaTuner Statistics Server has been upgraded to v6.5.0
Pokud někdo nezaznamenal, tak 1.11.2017 vyšla finální verze Afterburneru 4.4.0 včetně nové verze RTSS 7.0.0
Changes in version 4.4.0
Added core voltage control for reference design NVIDIA GeForce GTX 1070 Ti series graphics cards
Added core voltage control for reference design NVIDIA GeForce GT 1030 series graphics cards
Added core voltage control for reference design NVIDIA GeForce GTX TITAN Xp series graphics cards
Added core voltage control for reference design NVIDIA GeForce GTX 1080 Ti series graphics cards
Added support for NVIDIA GPUs working in TCC (Tesla Compute Cluster) mode
Hardware abstraction layer architecture has been revamped to allow implementation of memory temperature sensors via direct access to GPU on-die voltage controllers (e.g. AMD Vega 10 SMC) in addition to previously supported external memory temperature sensors connected to GPU via I2C bus
Added AMD Vega 10 graphics processors family support
Added core voltage control for reference design AMD Vega series cards with on-die SMC voltage controller
Added GPU power draw graph to hardware monitoring module for AMD Vega series graphics cards
Added HBM memory temperature graph to hardware monitoring module for AMD Vega series graphics cards
Added linear RPM-based fan speed control for reference design AMD Vega series graphics cards. Please take a note that traditionally fan speed adjustment scale is not linear and it is not directly mapped to RPM, traditional fan speed percent on other hardware is a PWM duty cycle. !MD Vega fan controller doesn’t support duty cycle based fan control mode, so specified fan speed percent is linearly mapped to maximum RPM percent
Improved voltage offset calculation accuracy for AMD Fiji, Ellesmere and Baffin GPU families
Improved voltage offset programming reliability on AMD Ellesmere and Baffin GPU families
Minimum voltage offset has been extended to -200mV for AMD Fiji and Ellesmere GPU families
Fixed stuck GPU usage and memory controller usage monitoring on AMD Radeon RX 500 series under 17.6.1 and newer drivers
Revamped voltage control layer gives additional freedom to extreme overclockers with new custom design MSI graphics cards with Quad Overvoltage™ technology support. Now MSI Afterburner is able to control up to 4 independent voltages on custom design MSI graphics cards
Improved 5-channel thermal monitoring module architecture provides support for up to 20 independent thermal sensors per GPU (up to 5 independent GPU, up to 5 independent PCB, up to 5 independent memory and up to 5 independent VRM temperature sensors) on future custom design MSI graphics cards
Added NCT7802Y thermal sensors support to provide compatibility with future custom design MSI graphics cards
Added core, memory, auxiliary PEXVDD and auxiliary 1V8 voltage control for custom design MSI GTX1080Ti Lightning Z series graphics cards with IR3595A+IR3570B+uP1816 voltage regulators
Added VRM, VRM2, VRM3, VRM4 and PCB temperature monitoring for custom design MSI GTX1080Ti Lightning Z series graphics cards with NCT7511Y thermal sensors
Improved hardware database format. New database subsections support provides more compact database definition for multiple graphics card models sharing similar hardware calibration info
New cached I2C device detection algorithm improves application startup time on the systems with multichannel voltage controllers or multichannel thermal sensors
Improved third-party voltage control mode functionality. Now third-party hardware database can also include extended thermal sensors calibration and mapping info for third-party custom design graphics cards
Added AMD Overdrive Next X2 overclocking API support for AMD Crimson 17.7.2 display drivers
The unofficial overclocking mode is currently broken in AMD Crimson 17.7.2 display drivers, so MSI Afterburner is forcibly disabling unofficial overclocking mode and always using official ADL overclocking codepath on 17.7.2 and newer drivers. However, unofficial overclocking mode can still be manually unlocked via configuration file on 17.7.2 and newer drivers if AMD decides to provide a fix for unofficial overclocking mode in the future
Improved PCI bus scanner provides support for low-level GPU access for the secondary graphics cards in Crossfire configuration on some platforms
Fixed system freeze issues when starting MSI Afterburner on AMD Hawaii GPU while playing hardware accelerated video
Fixed issue with opening wrong graph properties under certain conditions when right clicking a graph in hardware monitoring window and selecting “Properties” command from the context menu
Toggling locked curve point state with key is working properly now and no longer resulting in setting a lock to a minimum clock/frequency point
Now you may hold key while adjusting the offset of any point with mouse to move the curve up/down. That’s equal to adding fixed offset to each point’s offset
Various parts of the hardware monitoring module have been pumped up to improve hardware monitoring usability and flexibility. Some new portions of old hardcore functionality from original RivaTuner are now available in MSI Afterburner:
Added clock monitoring for Intel CPUs
CPU temperature graph is now displaying data from dedicated package sensor on modern Intel CPUs instead of maximum core temperature. On older Intel CPUs with no dedicated package sensor the graph is still displaying the maximum core temperature
Added temperature and clock monitoring for AMD Ryzen CPUs
Added new “benchmark” tab allowing you to use hidden RivaTuner Statistics Server’s benchmarking engine, which was previously available to reviewers only. The engine is providing you the following features:
You may define a hotkey for beginning framerate statistics recording. Once the recording begun, it stays active for all subsequently started 3D applications, even after rebooting the system
While recording is active you may enable showing own statistics in RivaTuner Statistics Server to see minimum, average and maximum framerate in the On-Screen Display
While recording is active you may press “_egin recording” hotkey one more time to restart the recording and reset the statistics
While recording is active you may press “End recording” hotkey once to end recording and save benchmark results to a text file, but keep the results shown in On-Screen Display. You may press the hotkey one more time to hide the results from the On-Screen Display
Statistics saved to a benchmark results file includes per-application total benchmarking time, total rendered frames number, global average, instantaneous minimum and instantaneous maximum framerates. Benchmark statistics file can be optionally either overwritten or appended on each recording session
Per-frame frametime statistics is being pushed to a named pipe so reviewers can use their own client software to collect and display it in realtime while any benchmark is running without system slowdown, which is typical for traditional per-frame frametime logging approach
New flexible On-Screen Display customization features powered by RivaTuner Statistics Server’s text formatting tags and embedded objects:
Added On-Screen Display layouts support. Layouts allow you to change On-Screen Display formatting and appearance style. Now you may switch between traditional classic On-Screen Display layout or new modern column-oriented On-Screen Display layout. Built-in layout editor allows you to customize pre-defined layout parameters in details
New On-Screen Display item type selection settings allow you to display each item in On-Screen Display as a text or graph. The graphs displayed in the On-Screen Display can be useful to visualize frametime history and GPU usage history, and so on
The maximum text length for “Override group name” setting is no longer limited by 8 symbols. Now you may embed new RivaTuner Statistics Server’s text formatting tags directly into your custom group name, e.g. “<C=FFFFFF>GTX 1080<S=-50=1<S=<C=” to display it in On-Screen Display in white color and with 50% size subscript index
Now it is allowed to override group names for “Framerate” and “Frametime” graphs, so you may append default application 3D API tag with some custom text or replace it completely if necessary
Exactly the same flexible level of On-Screen Display customization output is available to any other RivaTuner Statistics Server client applications like AIDA, HWiNFO and others and will be available shortly
Original RivaTuner’s task scheduler functionality is back! Now you may define optional minimum and (or) maximum thresholds for any graph in hardware monitor module to track the most critical hardware health parameters, to be notified on reaching a critical threshold and to program some emergency actions (e.g. system shutdown) to be performed in this case:
User-defined thresholds are displayed on each graph to allow you to control each parameter safety zone visually
When the threshold is reached blinking warning icon is displayed in top left corner of monitoring window and in Logitech keyboard LCD if graph LCD display mode is selected
When the threshold is reached you can see the name of graph triggering the alarm in hardware monitoring status line
When the threshold is reached background of the graph triggering the alarm is highlighted with color to allow you to identify it visually
When modern On-Screen Display layout is selected, parameters triggering the alarm are highlighted by color in On-Screen Display to allow you to identify it easily
You may enable option alarm sound notification to be played when the threshold is reached
You may configure MSI Afterburner to launch any external application when the threshold is reached. This feature allows you to implement many different scenarios, e.g. perform emergency system shutdown or apply safe profile with reduced overclocking, maximized fan speed etc. In addition to selecting any custom external applications, built-in predefined applications browser allows you to select some common typical usage scenarios, such as command line based MSI Afterburner profile activation or system shutdown
Original RivaTuner’s user extendable hardware monitoring plugins architecture is back! Now you may extend the list of hardware monitoring data sources with built-in or third party plugin modules, develop your own plugins to provide support for custom hardware sensors and share your work with community, and many more
The plugins can use full set of MSI !fterburner’s low-level hardware access functionality: enumerate GPUs, access GPU registers, enumerate GPU I2C buses and access I2C devices, access CPU MSR registers, access IO ports and PCI configuration space registers. This way you can easily create your own plugins providing hardware monitoring functionality for any custom hardware. You can also create the plugins for importing OS-specific or third-party software specific performance counters into MSI Afterburner
Open source SDK, demonstrating hardware monitoring plugins development principles to third party programmers.
The SDK includes the following open source plugins:
SMART.dll – demonstrates HDD SMART attributes readback and HDD temperature monitoring
PerfCounter.dll – demonstrates the principles of importing native OS performance counters into
MSI Afterburner. The list of imported performance counters includes but not limited to hard disk usage, hard disk read and write rates, free disk space on system partition, network download and upload rates. You may also add any other performance counter visible to OS (e.g. disk queue size or some specific process CPU usage) via editing the plugin configuration file
AIDA64.dll – demonstrates the principles of importing sensors from AIDA64 application via shared memory interface. The list of imported performance counters includes but not limited to motherboard temperature, CPU socket temperature, CPU fan speed, CPU voltage, CPU package power, +3.3V, +5V and +12V voltages. You may also add any other sensors available in AIDA64 via editing the plugin configuration file
HWInfo.dll -imports sensors from HWiNFO32/64 application via shared memory interface. The list of imported performance counters includes but not limited to motherboard temperature, CPU socket temperature, CPU fan speed, CPU voltage, CPU package power, +3.3V, +5V and +12V voltages. You may also add any other sensors available in HWiNFO32/64 via editing the plugin configuration file. Please take a not that the plugin is not open source per HWiNFO developer request
Improved profiles architecture. Now MSI Afterburner can store hardware monitoring module settings in the profile slots. This allows you to switch between different On-Screen Display configurations on the fly with hotkeys bound to profile slots. You may configure desired profile slot contents in new “Profile contents” settings group in “Profiles” tab
Added experimental interleaved hardware polling mode, aimed to reduce hardware polling time on the systems with multiple polled I2C devices. When interleaved polling is enabled, just a part of hardware monitoring data sources is being polled on each hardware polling period, so it takes multiple periods to refresh all monitoring data sources. Power users may enable interleaved hardware polling mode via the configuration file if necessary
Added ability to define a hotkey for hardware monitoring logging start and stop
Now the path to hardware monitoring logs supports macro names:
You may use new %ABDir% macro in the path to specify relative path to current MSI Afterburner installation directory. This macro allows you to use logging if you are using portal installation and start MSI Afterburner from removable drive
You may use new %Time% macro in the path to make hardware monitoring sessions to be stored in unique timestamp-named log files instead of single multi-session log file
Changed hardware monitoring properties layout, the controls have been reordered a bit to give more compact and convenient look to the properties
Changed default hardware monitoring graphs order. GPU related graphs have been reordered a bit in order to provide more convenient layout on multi-GPU systems. “Framerate” and “Frametime” graphs have been moved to the bottom of the list
Now you may right-click the list of active hardware monitoring graphs and select “Reset order” command from the context menu to restore default active hardware monitoring graphs order
The maximum limit for “Frametime” graph has been decreased to 50ms (20 FPS) by default
Improved drag and drop implementation for the list of active hardware monitoring graphs. Now it is possible to drag and drop items below the bottom edge of the list to move the graphs to the end of the list
Improved multiple selection functionality:
Now you may hold key when clicking a checkmark next to a graph name in the list of active hardware monitoring graphs to enable or disable all graphs at once
Now you may hold or keys to select multiple items in the list of active hardware monitoring graphs. The following functionality is available for multiple selected hardware monitoring graphs: • Multiple selected graphs can be dragged and dropped when rearranging the graphs • When multiple hardware monitoring graphs are selected, you may hold key when changing
graph specific On-Screen Display, Logitech keyboard LCD and tray icon related properties (e.g. “Show in On-Screen Display” property) to change it synchronically for all selected graphs
When multiple hardware monitoring graphs are selected, you may hold when clicking a checkmark next to a graph name in the list of active hardware monitoring graphs to enable or disable all selected graphs at once
When multiple graphs are selected you may press + inside group name edit field to apply group name changes synchronically to all selected graphs Now “Override graph name” and “Override group name” checkboxes are also affected by multiple selection functionality, so you may hold when toggling those options to toggle it synchronically for all graphs or hold when toggling those options to toggle it synchronically for all selected graphs.
Improved system information window. Now 3D API usage info, x64 and UWP application architecture attributes are displayed for each currently running process in the list of active 3D applications
Now the installer is preserving installation path
RivaTuner Statistics Server has been upgraded to v7.0.0
MSI Afterburner v4.6.0 beta 9 (build 13319)
Added NVIDIA Turing GPU architecture support:
o Added voltage control for reference design NVIDIA GeForce RTX 20x0 series graphics cards
o Advanced GPU Boost control for NVIDIA GeForce RTX 20x0 series graphics cards. Extended voltage/frequency curve editor on GeForce RTX 20x0 family graphics cards allows you to tune additional piecewise power/frequency floor and temperature/frequency floor curves. Control points on those new curves allow you to control GPU Boost power and thermal throttling algorithms more precisely than traditional power limit and thermal limit sliders
o Hardware abstraction layer has been revamped to provide support for multiple independent fans per GPU due to introducing dual fan design on reference design NVIDIA GeForce RTX 20x0 series graphics cards and due to introducing native dual fan control in NVAPI. Both fans of NVIDIA GeForce RTX 20x0 can be monitored independently in hardware monitoring module now and can be controlled synchronically in manual mode
o Added NVIDIA Scanner technology support
· Improved hardware monitoring module:
o Added thermal offset for CPU temperature monitoring on AMD Ryzen 7 2700X processors
o “Pagefile usage” graph in hardware monitoring module has been renamed to “Commit charge”
· Improved hardware control shared memory interface. During the past years, external applications like MSI Remote Server were using this interface for tuning GPU hardware settings remotely from external applications. The improvements are intended to allow connecting external stress testing and automatic overclocking related applications to MSI Afterburner via this interface:
o Now voltage/frequency curve on NVIDIA Pascal and newer NVIDIA GPU architectures is accessible via hardware control shared memory interface
o New hardware control shared memory interface command allows MSI Afterburner to load hardware settings from external application without immediately applying new settings to GPU
o Added notification message, allowing external applications to notify MSI Afterburner about new command written to hardware control shared memory. Without the notification, MSI Afterburner is executing external commands on each hardware polling iteration like before. Please refer to SDK and MACMSharedMemorySample source code to see notification message usage example
o Added hardware identification info to GPU entries in hardware control shared memory. Hardware identification info allows external applications to reconcile own enumerated devices with logical GPUs enumerated by MSI Afterburner
o Now hardware control shared memory is refreshed on delayed fan speed readback events
· New bundled MSI Overclocking Scanner application in now included in MSI Afterburner distributive:
o MSI Overclocking Scanner is currently supported on NVIDIA RTX 20x0 series graphics cards under 64-bit operating systems only. On such systems you may activate the scanner directly from voltage/frequency curve editor window
o MSI Overclocking Scanner is powered by NVIDIA Scanner technology, which is using proprietary algorithms to quickly and reliably test manually overclocked GPU stability or find the maximum stable GPU overclocking in automatic mode with a single click. The scanner is using embedded NVIDIA test load to stress GPU. The scanner provides you two functional modes:
§ In test mode MSI Overclocking Scanner is stress-testing your manual GPU overclocking settings during approximately 5 minutes. The result is returned as GPU stability confidence level (0% - unstable, 100% - stable)
§ In scan mode MSI Overclocking Scanner is stress-testing and slowly increasing clocks on voltage/frequency curve points and this way automatically detecting the maximum stable GPU overclocking. The result is returned as modified voltage/frequency curve and average GPU overclocking in MHz
· Hardcoded voltage/frequency curve clock multiplier implementation has been replaced with heuristic multiplier detection in order to provide unified voltage/frequency curve control implementation for NVIDIA Pascal and newer NVIDIA GPU architectures
· Improved realtime voltage/frequency curve editor GUI scaling. Now GUI is scaled property when adjusting skin scaling with open voltage/frequency curve editor window
· Added Monolithic Power Systems MP2888A voltage controllers support to provide compatibility with future custom design MSI graphics cards
· RivaTuner Statistics Server has been upgraded to v7.2.0
RivaTuner Statistics Server v7.2.0 beta 5
· Added On-Screen Display performance profiler. Power users may enable it to measure and visualize CPU and GPU performance overhead added by On-Screen Display rendering. Two performance profiling modes are available:
o Compact mode provides basic and the most important CPU prepare (On-Screen Display hypertext formatting, parsing and tessellation), CPU rendering and total CPU times, as well as GPU rendering time (currently supported for Direct3D9+ and OpenGL applications only)
o Full mode provides additional and more detailed per-stage CPU times
· Improved built-in framerate limiter:
o Fractional framerate limit adjustment functionality is no longer power user oriented, now you may specify fractional limit directly from GUI
o Now you may click “Framerate limit” caption to switch framerate limiter to alternate “Frametime limit” mode. New mode allows you to specify the limit directly as a target frametime with 1 microsecond precision
o Added alternate framerate limiting mode, based on synchronization with display rasterizer position. Now you may synchronize the framerate to up to two independent scanline indices per refresh interval. Combining with power user configurable scanline wait timeout and graphics pipeline flushing options, those settings provide experienced users vendor agnostic ultra low input lag adaptive VSync, half VSync or double VSync functionality on any hardware
o Added power user oriented idle framerate limiting mode. Unlike traditional framerate limiting mode, idle framerate limiting mode is only affecting inactive 3D applications running in background. Idle framerate limit is specified as a target frametime with 1 microsecond precision. Idle framerate limiting mode helps to reduce power consumption when you minimize some heavy 3D applications and switch to other processes
· Various On-Screen Display optimizations and improvements:
o Added adjustable minimum refresh period for On-Screen Display renderer. The period is set to 10 milliseconds by default, so now the On-Screen Display is not allowed to be refreshed more frequently than 100 times per second. Such implementation allows keeping smooth animation when On-Screen Display contents are being updated on each frame (e.g. when displaying realtime frametime graph) without wasting too much CPU time on it
o Added alternate GPU copy based Vector2D On-Screen Display rendering mode implementation for Direct3D1x applications. New mode provides up to 5x Vector2D performance improvement on NVIDIA graphics cards, however it is disabled on AMD hardware due to slow implementation of CopySubresourceRegion in AMD display drivers
o Vector2D rendering mode is now forcibly disabled in Vulkan applications on AMD graphics cards due to insanely slow implementation of vkCmdClearAttachments in AMD display drivers
o Revamped geometry batching and vertex buffer usage strategy in pure Direct3D12 On-Screen Display renderer (currently used in Halo Wars 2 only)
o Added Vector2D rendering mode support to pure Direct3D12 On-Screen Display renderer
o Optimized On-Screen Display hypertext parsing and tessellation implementation
o Optimized state changes in OpenGL On-Screen Display rendering implementation
o Optimized state changes in Direct3D1x On-Screen Display rendering implementation
o Solid rectangles and line primitives in Direct3D8 and Direct3D9 On-Screen Display rendering implementations are now rendered from vertex buffer instead of user memory
o Improved OpenGL framebuffer dimensions detection when framebuffer coordinate space is selected
o Increased static command buffer size for Vulkan and pure Direct3D12 renders to increase amount of primitives rendered in On-Screen Display in a single pass
· Improved desktop duplication based desktop video capture implementation ( Windows 8 and newer OS versions):
o Now desktop video recording sessions do not stop on display mode switch or on switch to exclusive fullscreen mode. Such approach allows you to start capturing video on desktop then launch some 3D application and create a video file containing both desktop and 3D application’s video streams
o Improved video capture API allows video capture frontend applications (e.g. MSI Afterburner) to force desktop or 3D application video capture modes in addition to default mixed desktop/3D application capture mode
o Now desktop capture is using multhithreaded active busy-wait loop frame capture instead of timer driven frame capture in order to improve frame timing precision and resulting video smoothness. The previous timer driven frame capture can be enabled via configuration file if necessary
o Decreased desktop duplication timeouts in order to improve RivaTuner Statistics Server GUI response time under certain conditions during desktop videocapture sessions in timer driven frame capture mode
· Fixed On-Screen Display rendering in wrong colors when Vector2D mode is selected and Direct3D1x applications use 10-bit framebuffer
· Fixed Vulkan fence synchronization issue, which could cause GPU-limited Vulkan applications to hang due to attempt to reuse busy command buffer
· Active busy-wait loop in the framerate limiter module is now forcibly interrupted during unloading the hooks library to minimize the risk of deadlocking 3D application when dynamically closing RivaTuner Statistics Server during 3D application runtime
· Improved CBT hooks uninstallation routine to minimize the risk of deadlocking 3D application when dynamically closing RivaTuner Statistics Server during 3D application runtime
· Improved validation in OpenGL On-Screen Display rendering routine to minimize the risk of crashing OpenGL applications
· Changed OpenGL cleanup routines to improve compatibility with OpenGL applications using multiple rendering contexts (e.g. GPU Caps Viewer)
· Improved synchronization in 32-bit API hook uninstallation routines
· Added timeout to API hooks injection in CBT hook handler. The timeout is aimed to reduce injection related CPU overhead on some systems, related to high mouse polling rate combined with keyboard/mouse hooks installed by third party applications
· Interoperability D3D10 page flips on some systems are now filtered by framerate calculation module in OpenGL/Vulkan applications
· Added tri-state skinned buttons support in the skin engine
· Updated profiles list
Zdravím,- po spuštění MSI Kombustoru se otevře pouze malé a neúplné okno nastavení.Zkoušel jsem přeinstalovat,ale pořád je to stejné.Afterburner funguje normálně.Můžete prosím poradit?Děkuji.
Měl bych dotaz,
v článku o Reshade minulý týden zde: https://pctuning.tyden.cz/multimedia/hr ... y?start=10
autor používá v OSD zobrazení název procesoru, jméno grafické karty atd.
Nikde jsem tuto volbu v Afterburneru nenašel. Jak to tam dostal?
edit// případně bych poprosil autora článku, ale nemám na něj kontakt.....
Screenshot_2019-11-26 Freestyle a Reshade S filtry zdarma za krásnější hry.jpg
díky, to mi taky napadlo, ale nechci mít k afterburneru spuštěný další program jen kvůli názvu.... myslel jsem že to jde nějak přímo z toho afterburneru....
přešel jsem z WIN7 na 10ky. A nevim proč MSI Af. mi davá hned automticky 3D profil i pod normalním používání woken. i když CPU vytížení je kolem 1-2%. Netuší někdo proč nebo jak ho dunutit program aby daval defaultne 2D profil?
přešel jsem z WIN7 na 10ky. A nevim proč MSI Af. mi davá hned automticky 3D profil i pod normalním používání woken. i když CPU vytížení je kolem 1-2%. Netuší někdo proč nebo jak ho dunutit program aby daval defaultne 2D profil?
profily mam samozřejmě nastavené a assignuté.
Nemáš nastavený v ovladačích grafiky výkon v globálním nastavení na "vysoký" ? Měl by být na "optimální" (u Nvidie) a vysoký výkon nastavit až u jednotlivých her.
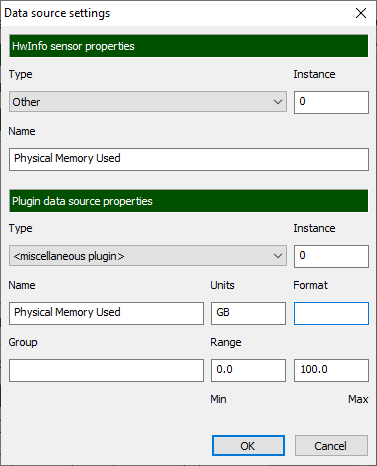
Tusi nekdo, co se ma vyplnit do policka format, kdyz chci hodnotu poskytnutou HWinfem vydelit tisicem - misto MB bych chtel GB vyuzite RAM. Zadnou dokumentaci jsem k tomu nenasel.
Diky. Podle toho navodu jsem sice nepochopil ten overlay editor, ale nakonec jsem prekonvertoval MB na GB pres "correction formula" x/1024 a to mi ke spokojenosti staci.
Pánové mám dva dotazy.
1) nejde sledovat AVG FPS ,ani min ,ani max, ani low. Prostě ty položky se tam nezobrazí když je mám zaškrtnuty a mám je i v "in ODS".
2) Jak udělat undervolt , respektivně zarovnaní té křivky co je ve videu v 2:32 že se mu to celé srovná.
Nějaká klávesová zkratka ? https://www.youtube.com/watch?v=A6kj5LoPhZQ
GaGy píše:Pánové mám dva dotazy.
1) nejde sledovat AVG FPS ,ani min ,ani max, ani low. Prostě ty položky se tam nezobrazí když je mám zaškrtnuty a mám je i v "in ODS".
2) Jak udělat undervolt , respektivně zarovnaní té křivky co je ve videu v 2:32 že se mu to celé srovná.
Nějaká klávesová zkratka ? https://www.youtube.com/watch?v=A6kj5LoPhZQ
To první nevím, taky by mě to zajímalo, ale to zarovnání křivky dělám tak, že si přes CTRL+F otevřu graf, pak dám reset, GPU clock stáhnu posuvníkem úplně doleva. Pak jen potáhnu požadovaný bod na grafu na požadovanou hodnotu (u mě tedy 0.875v na 1830 MHz) a dám APLY. Srovná se to samo.


